WhitePhosphorus.info

Figma, React, Next.js, D3.js, ArcGIS, Tailwind CSS

To the site⤤

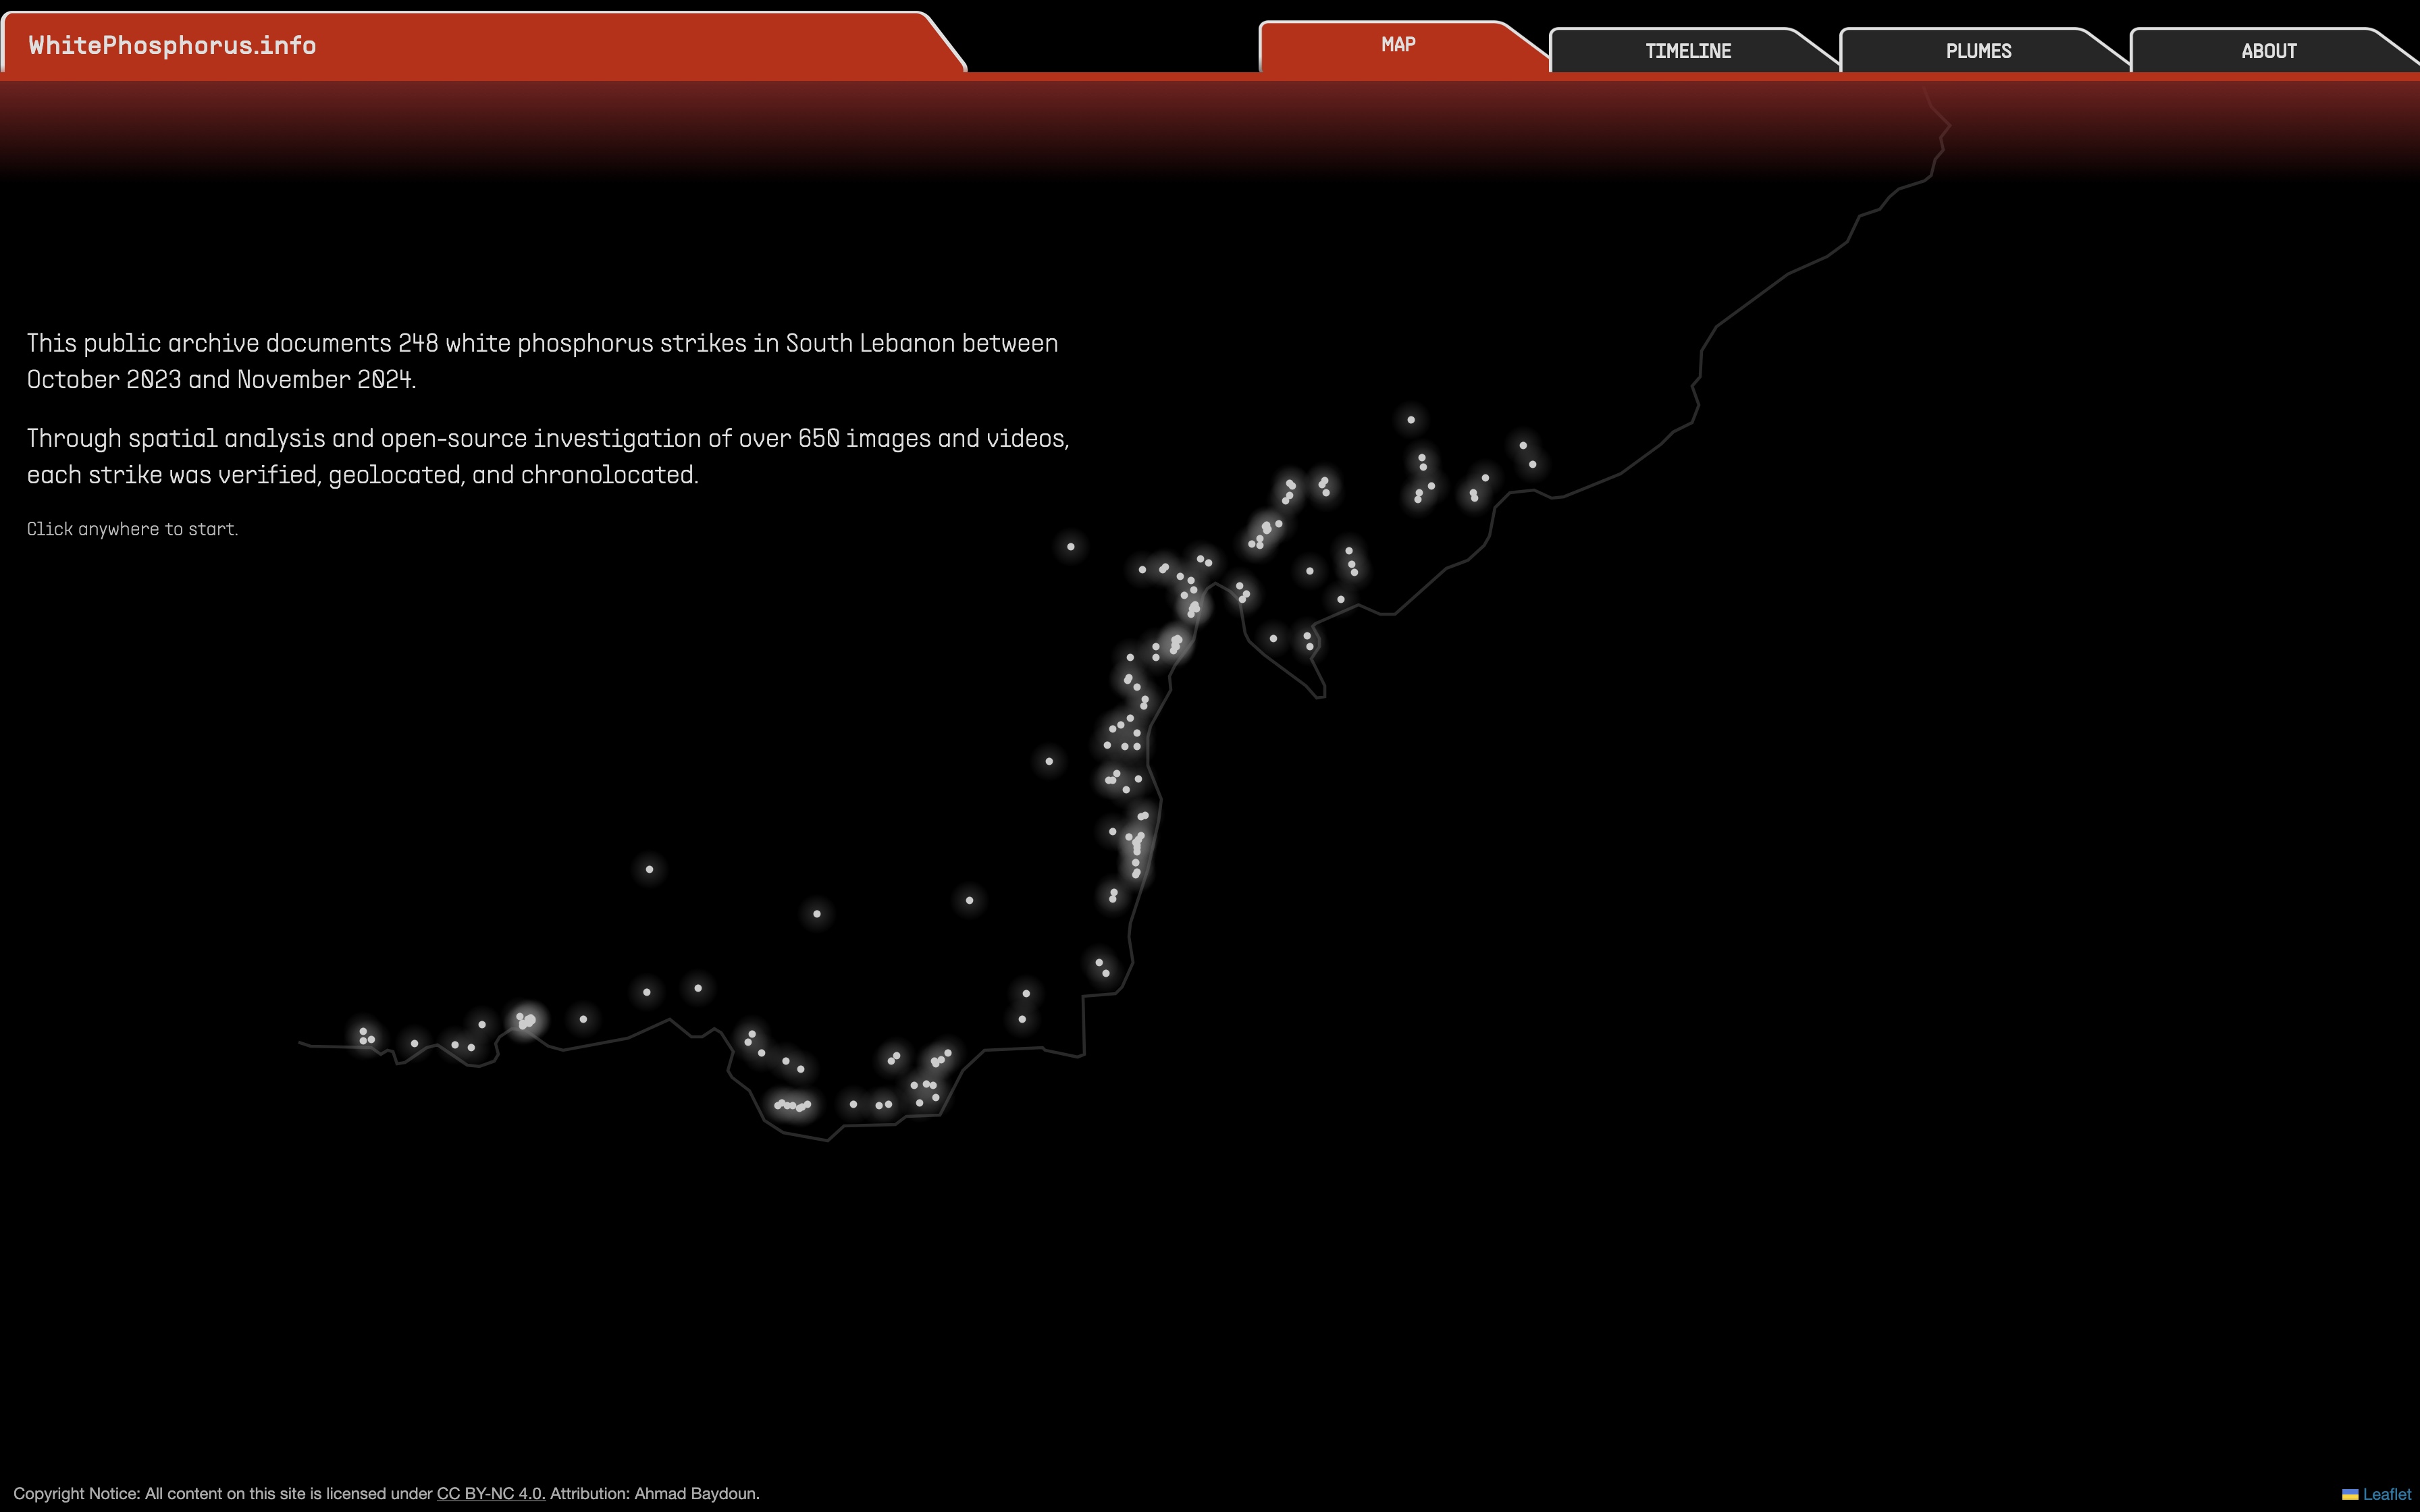
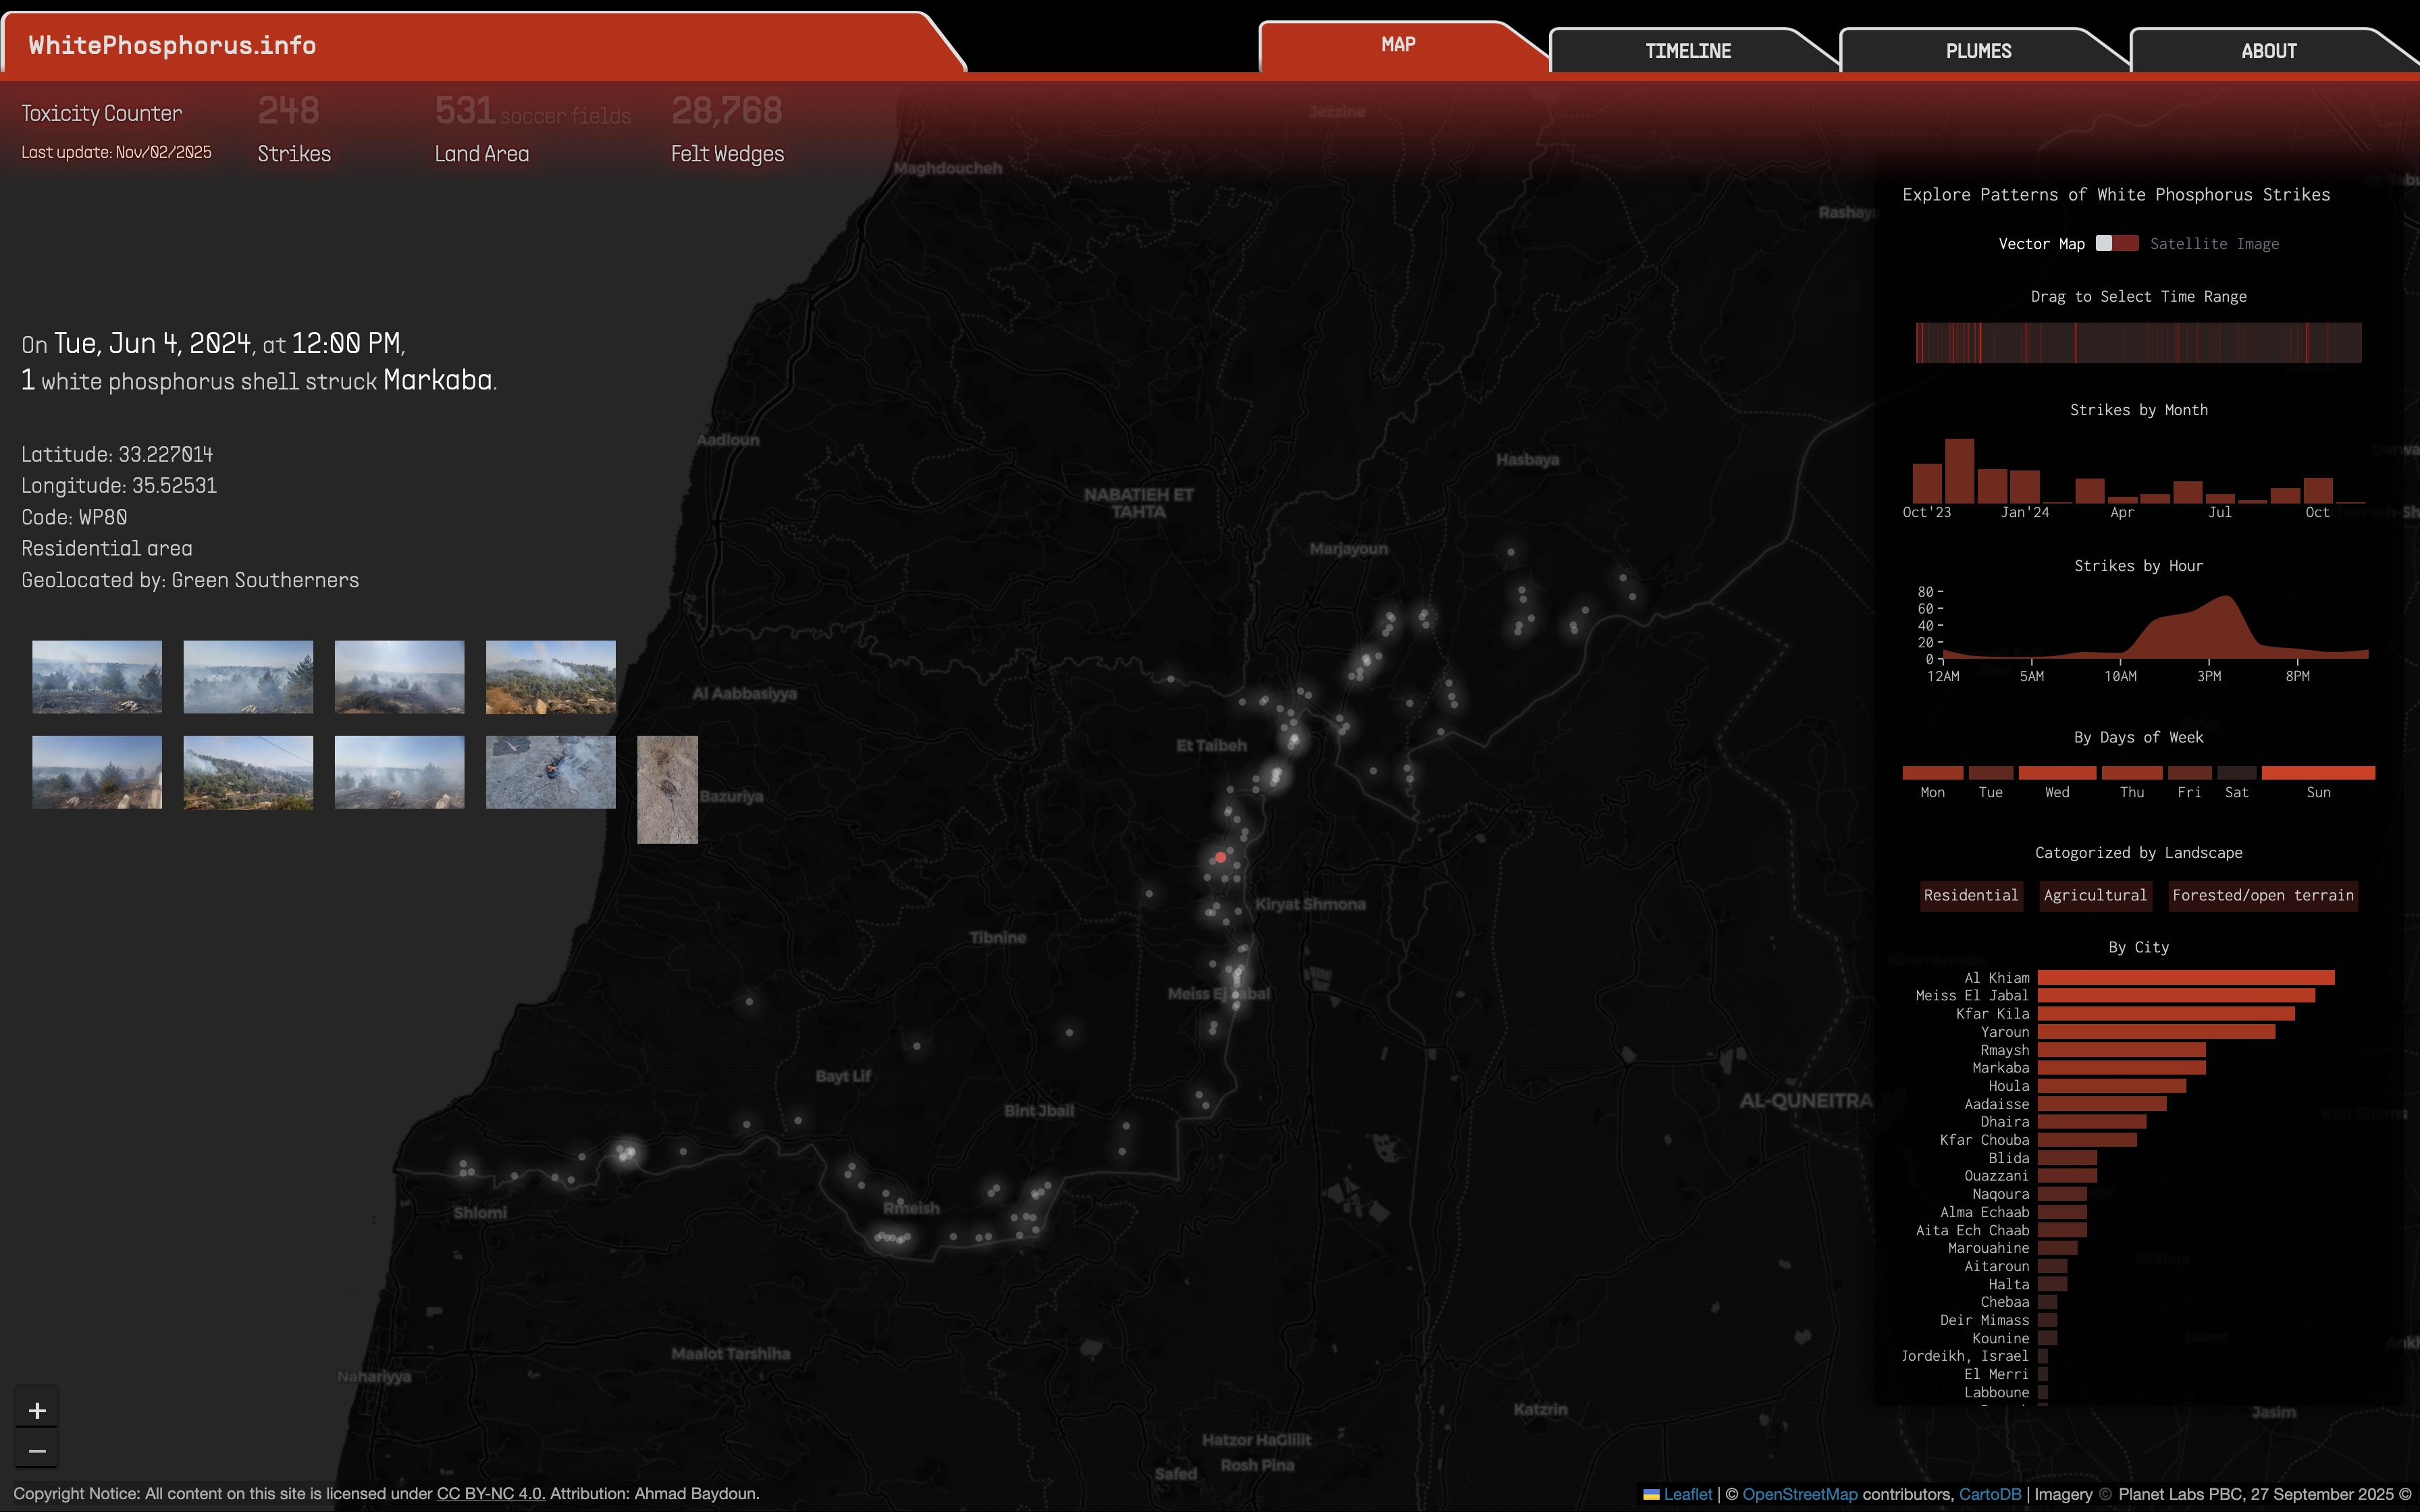
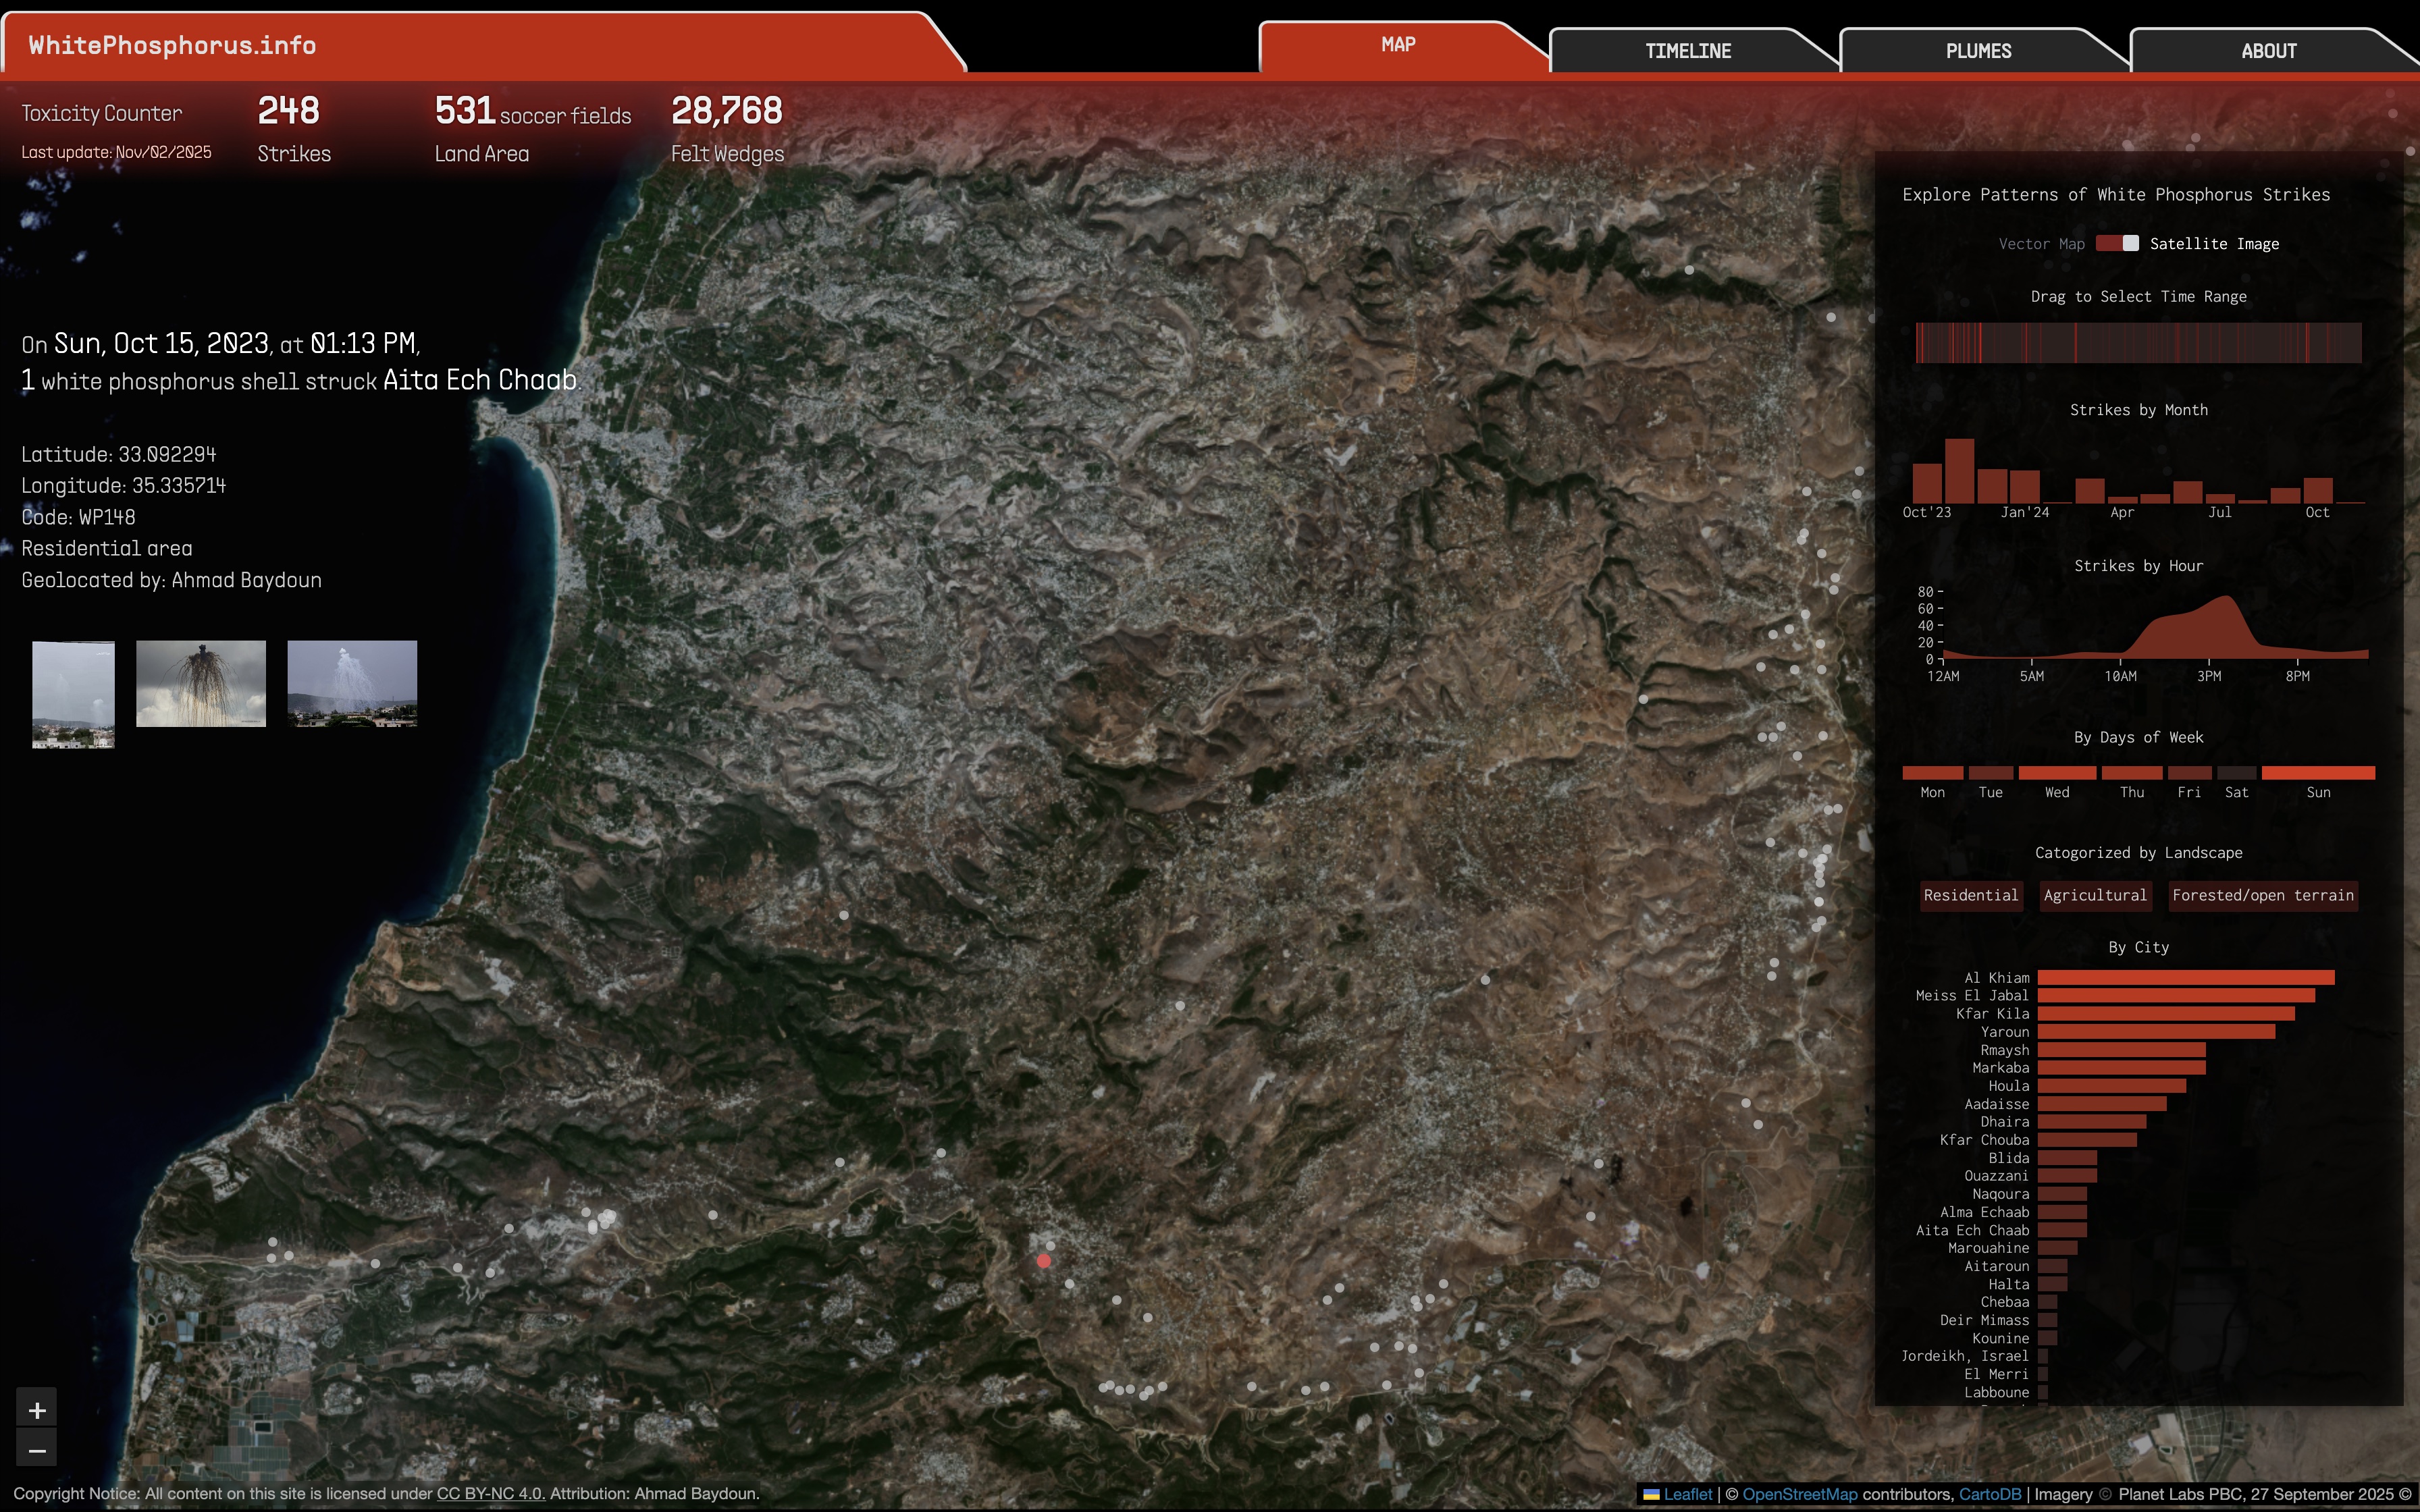
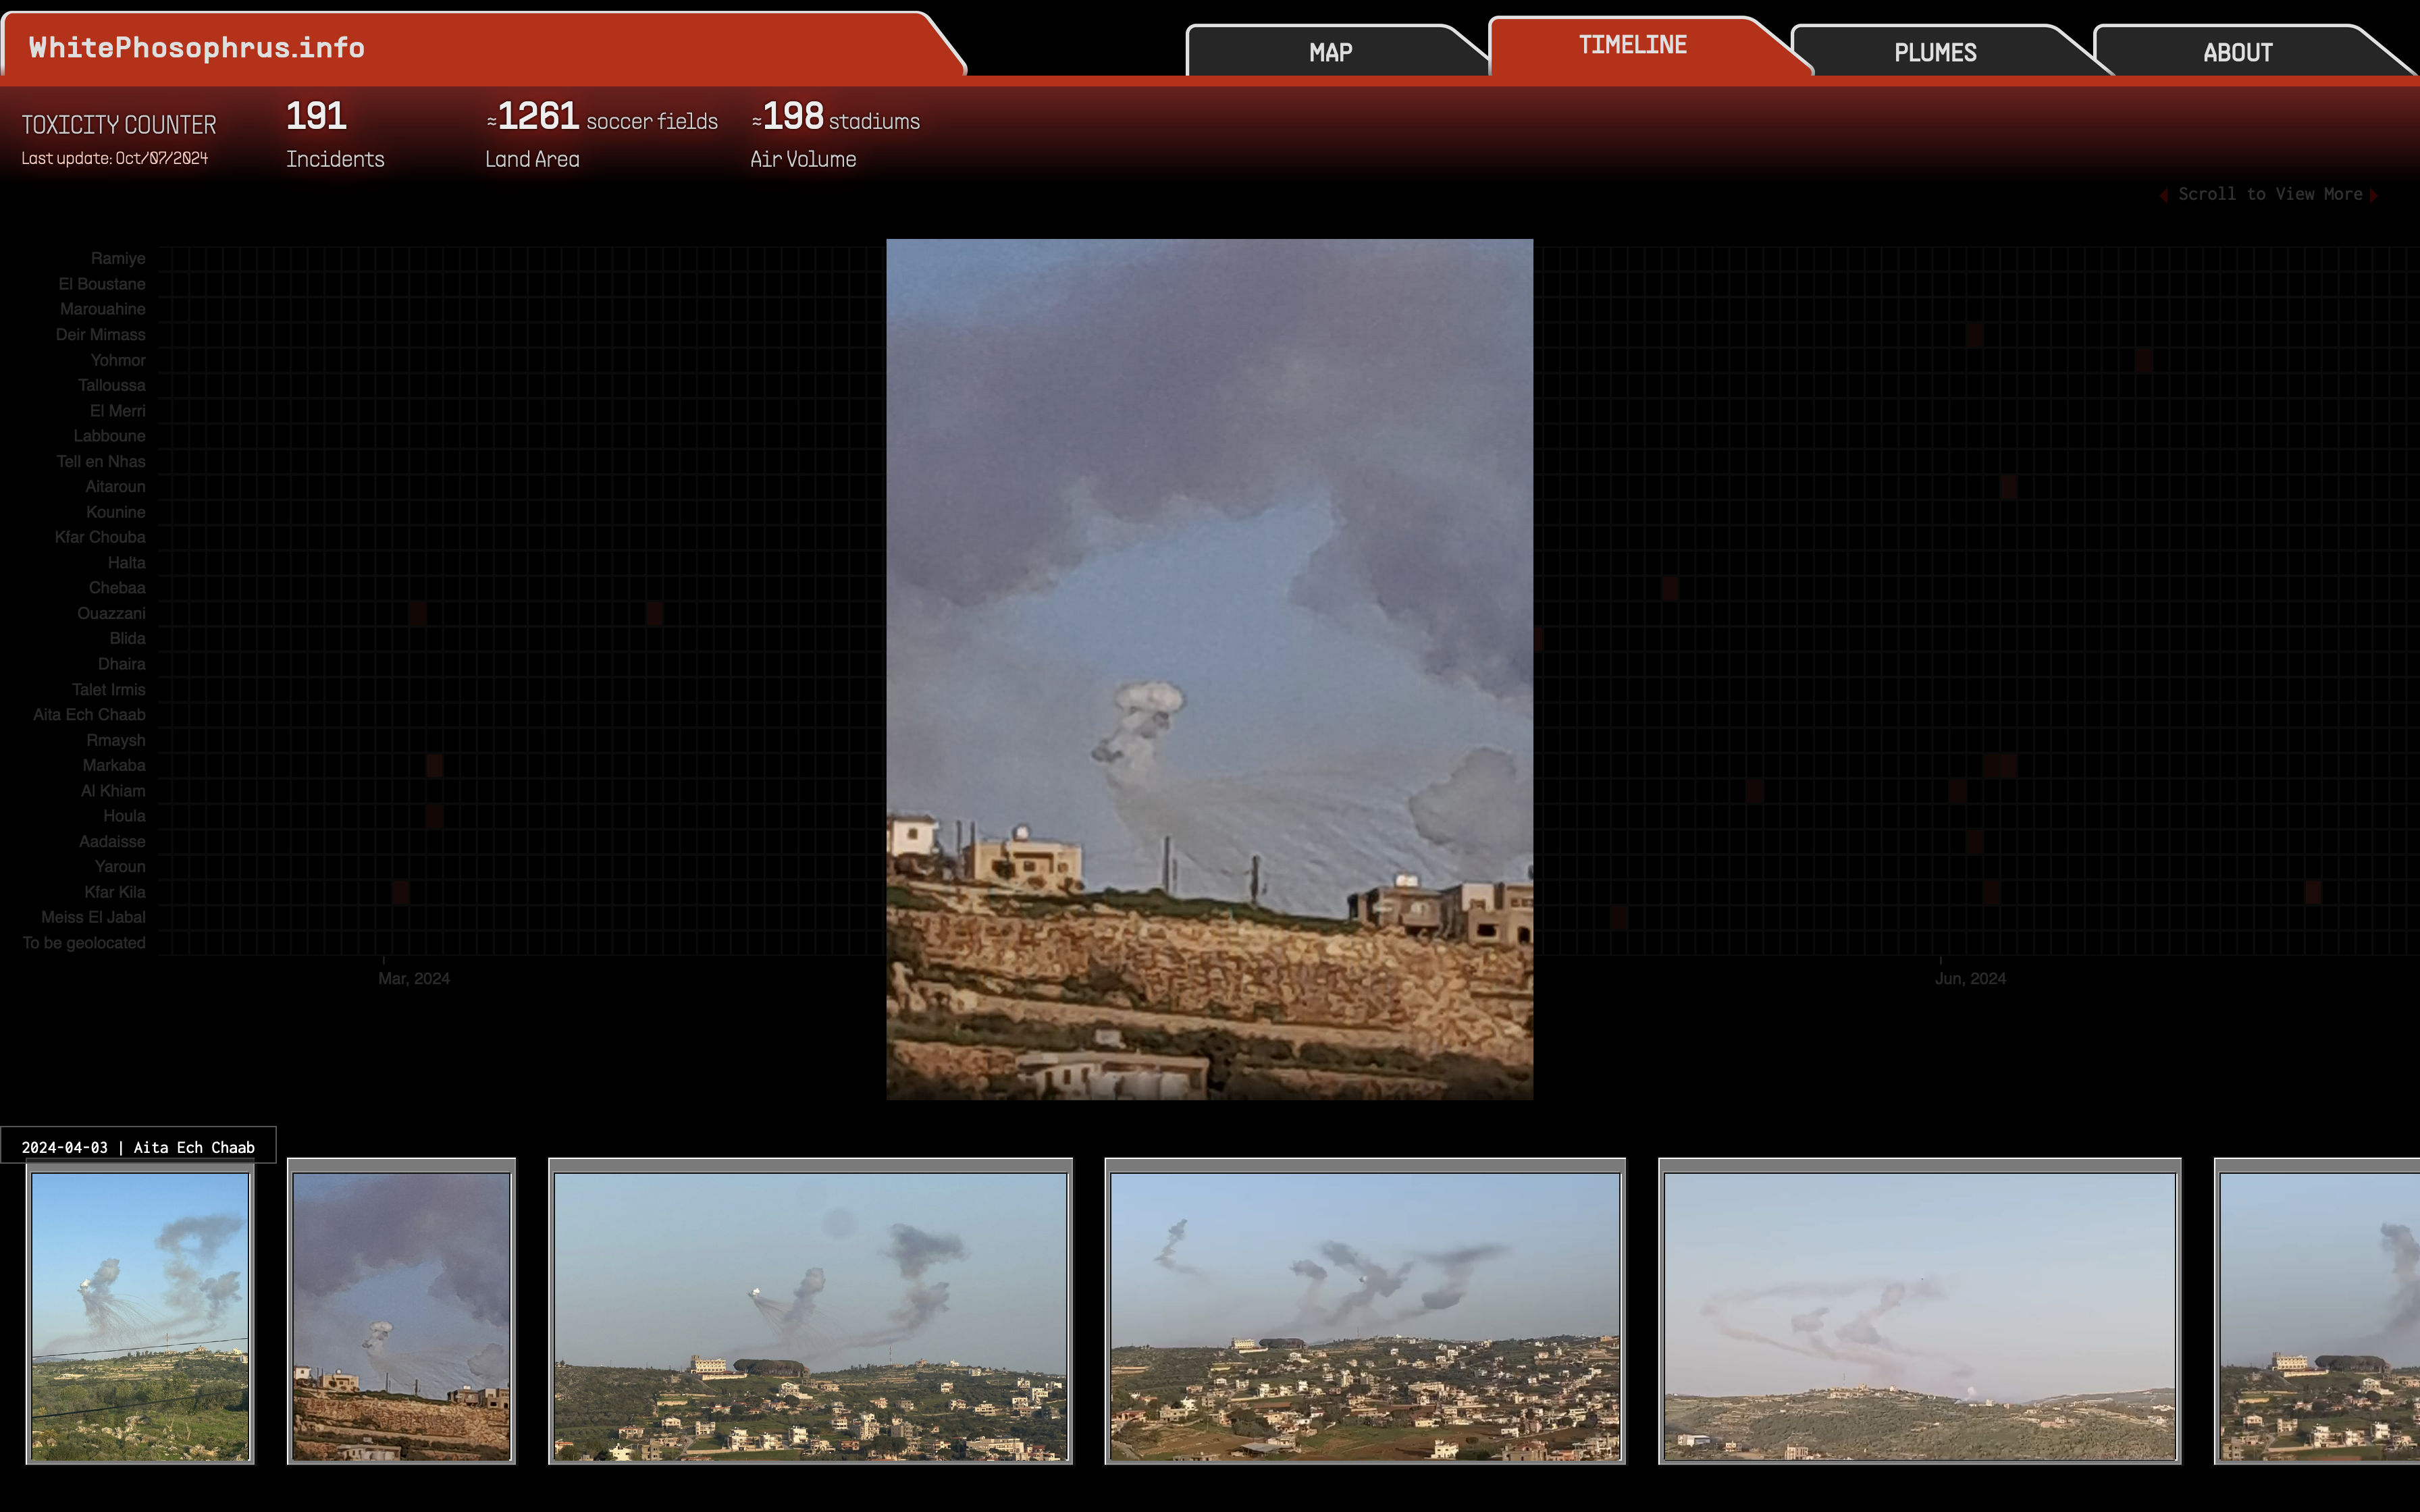
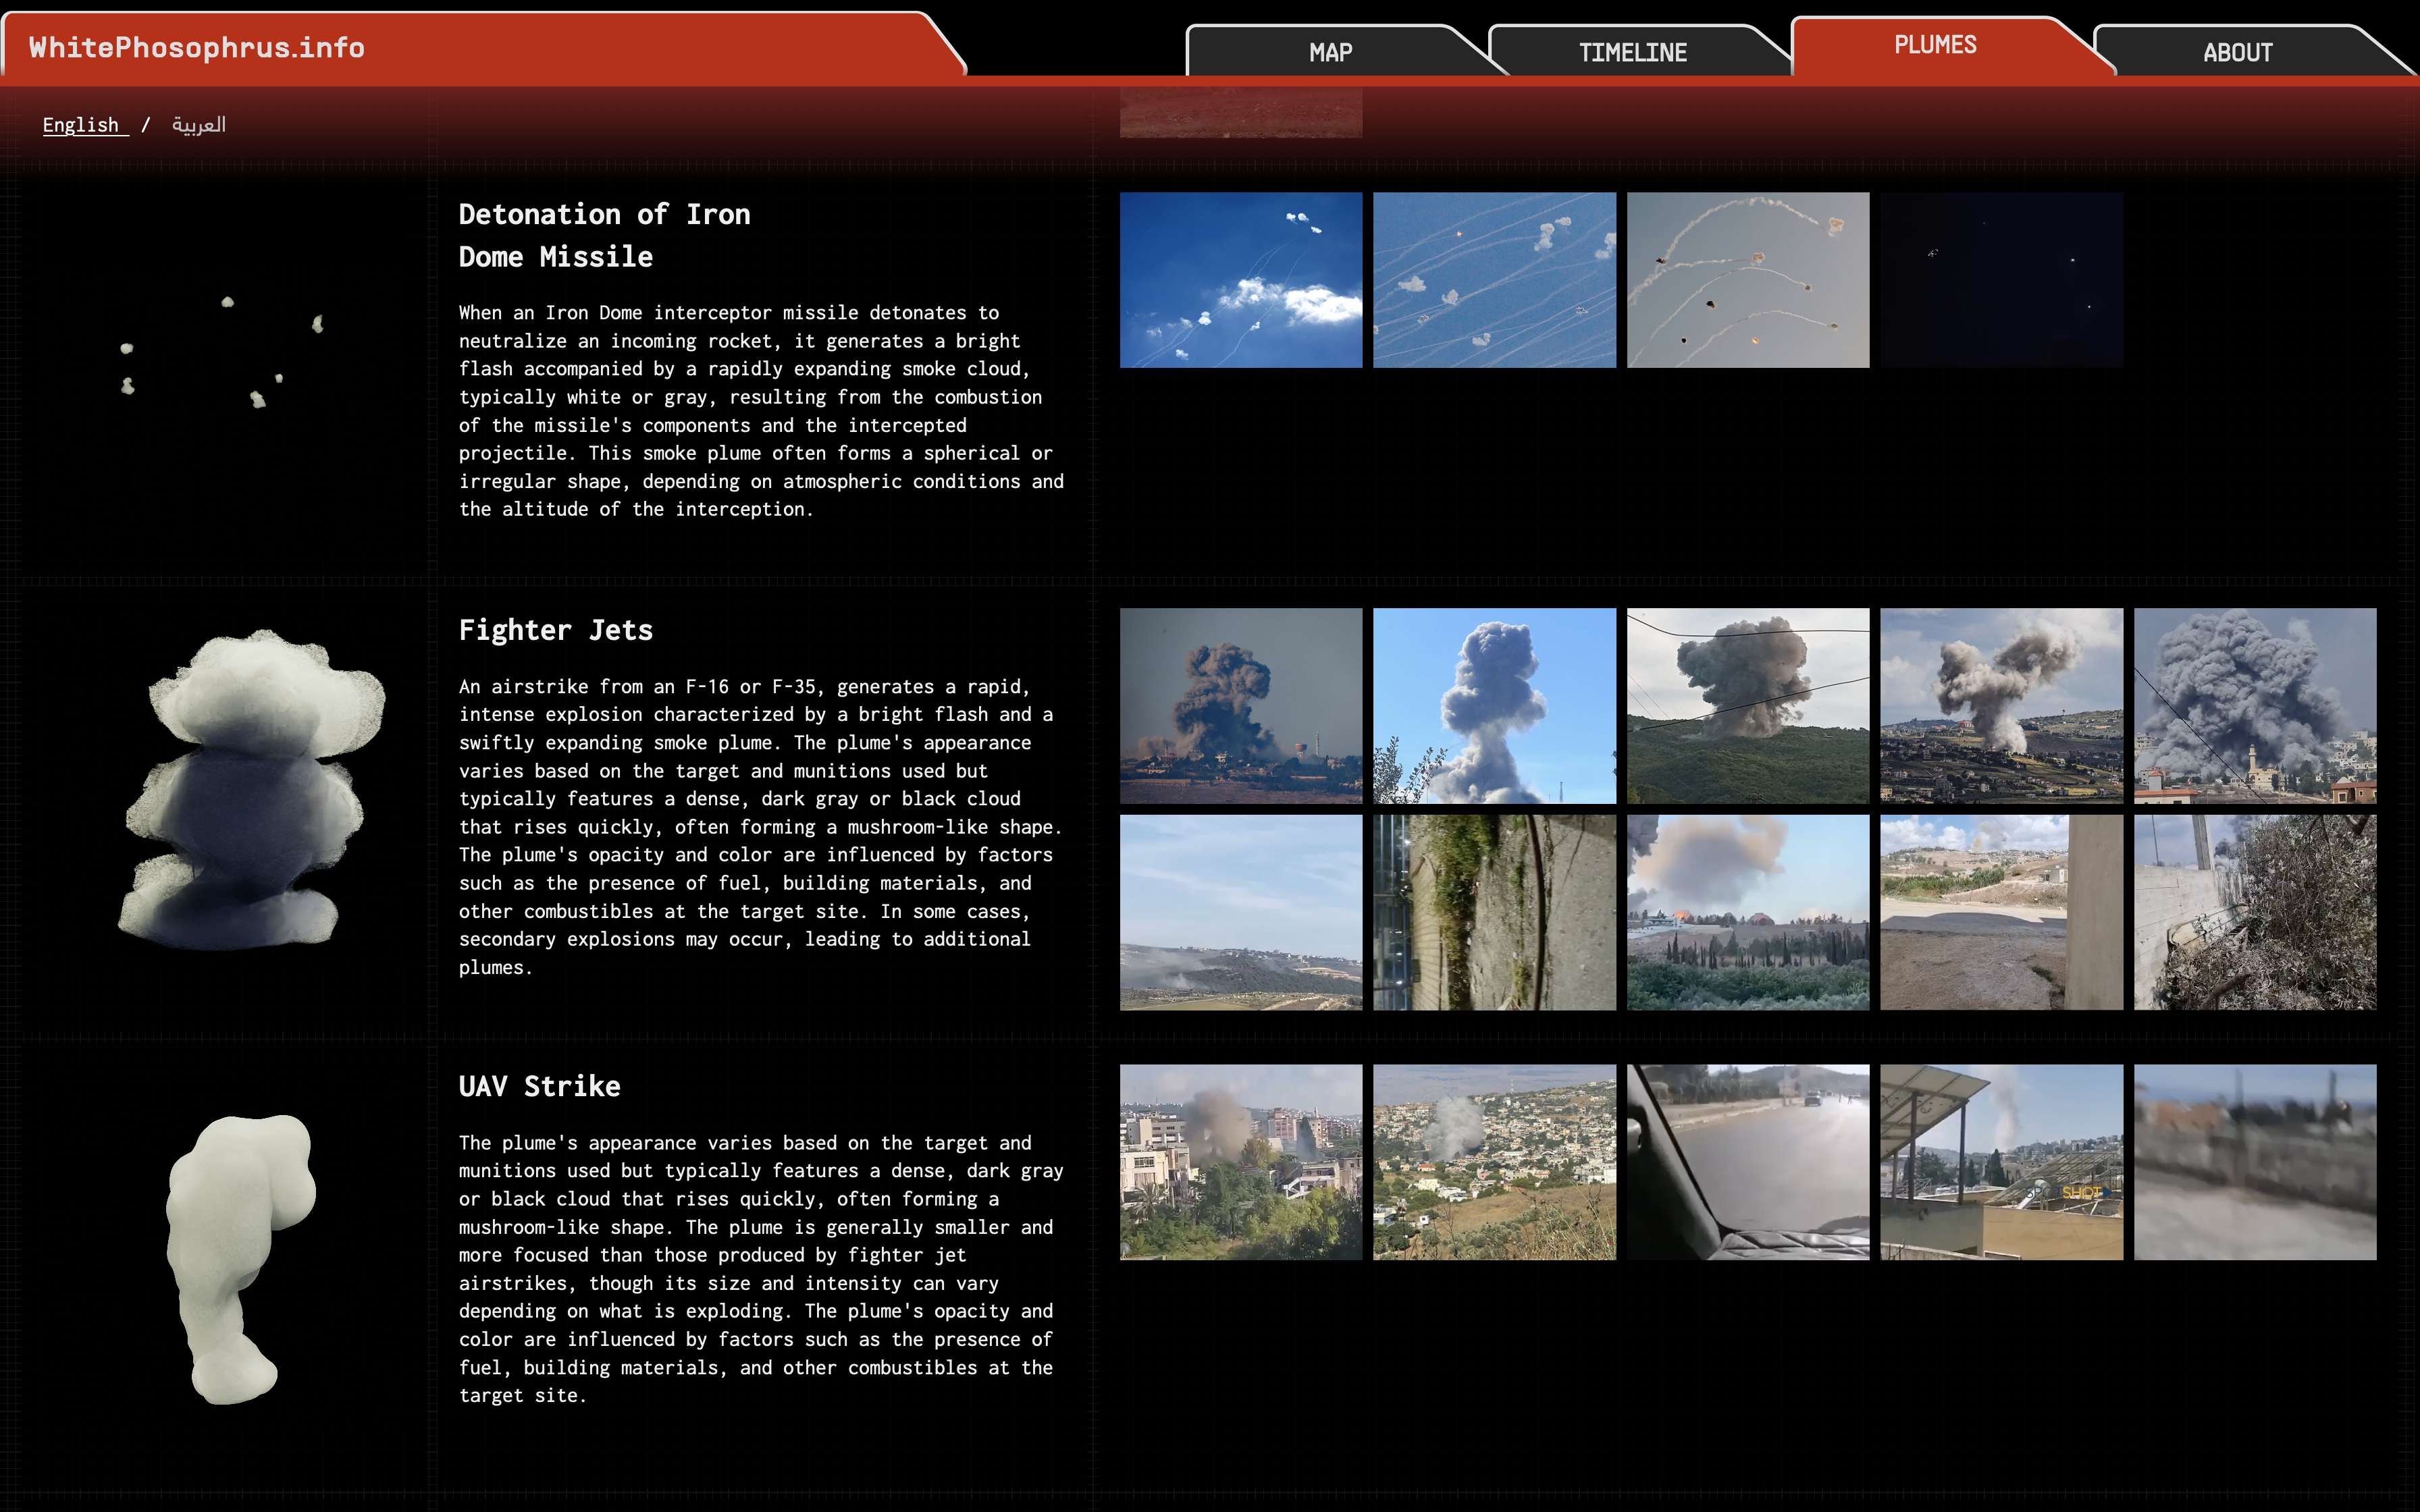
WhitePhosphorus.info is a website dedicated to documenting, visualizing, and analyzing white phosphorus attacks in South Lebanon. It features an interactive cartographic display that organizes incident data both chronologically and spatially, providing detailed insights into deployment patterns. The site serves as a continuously updated database for tracking the use of white phosphorus munitions in the region.

My Role

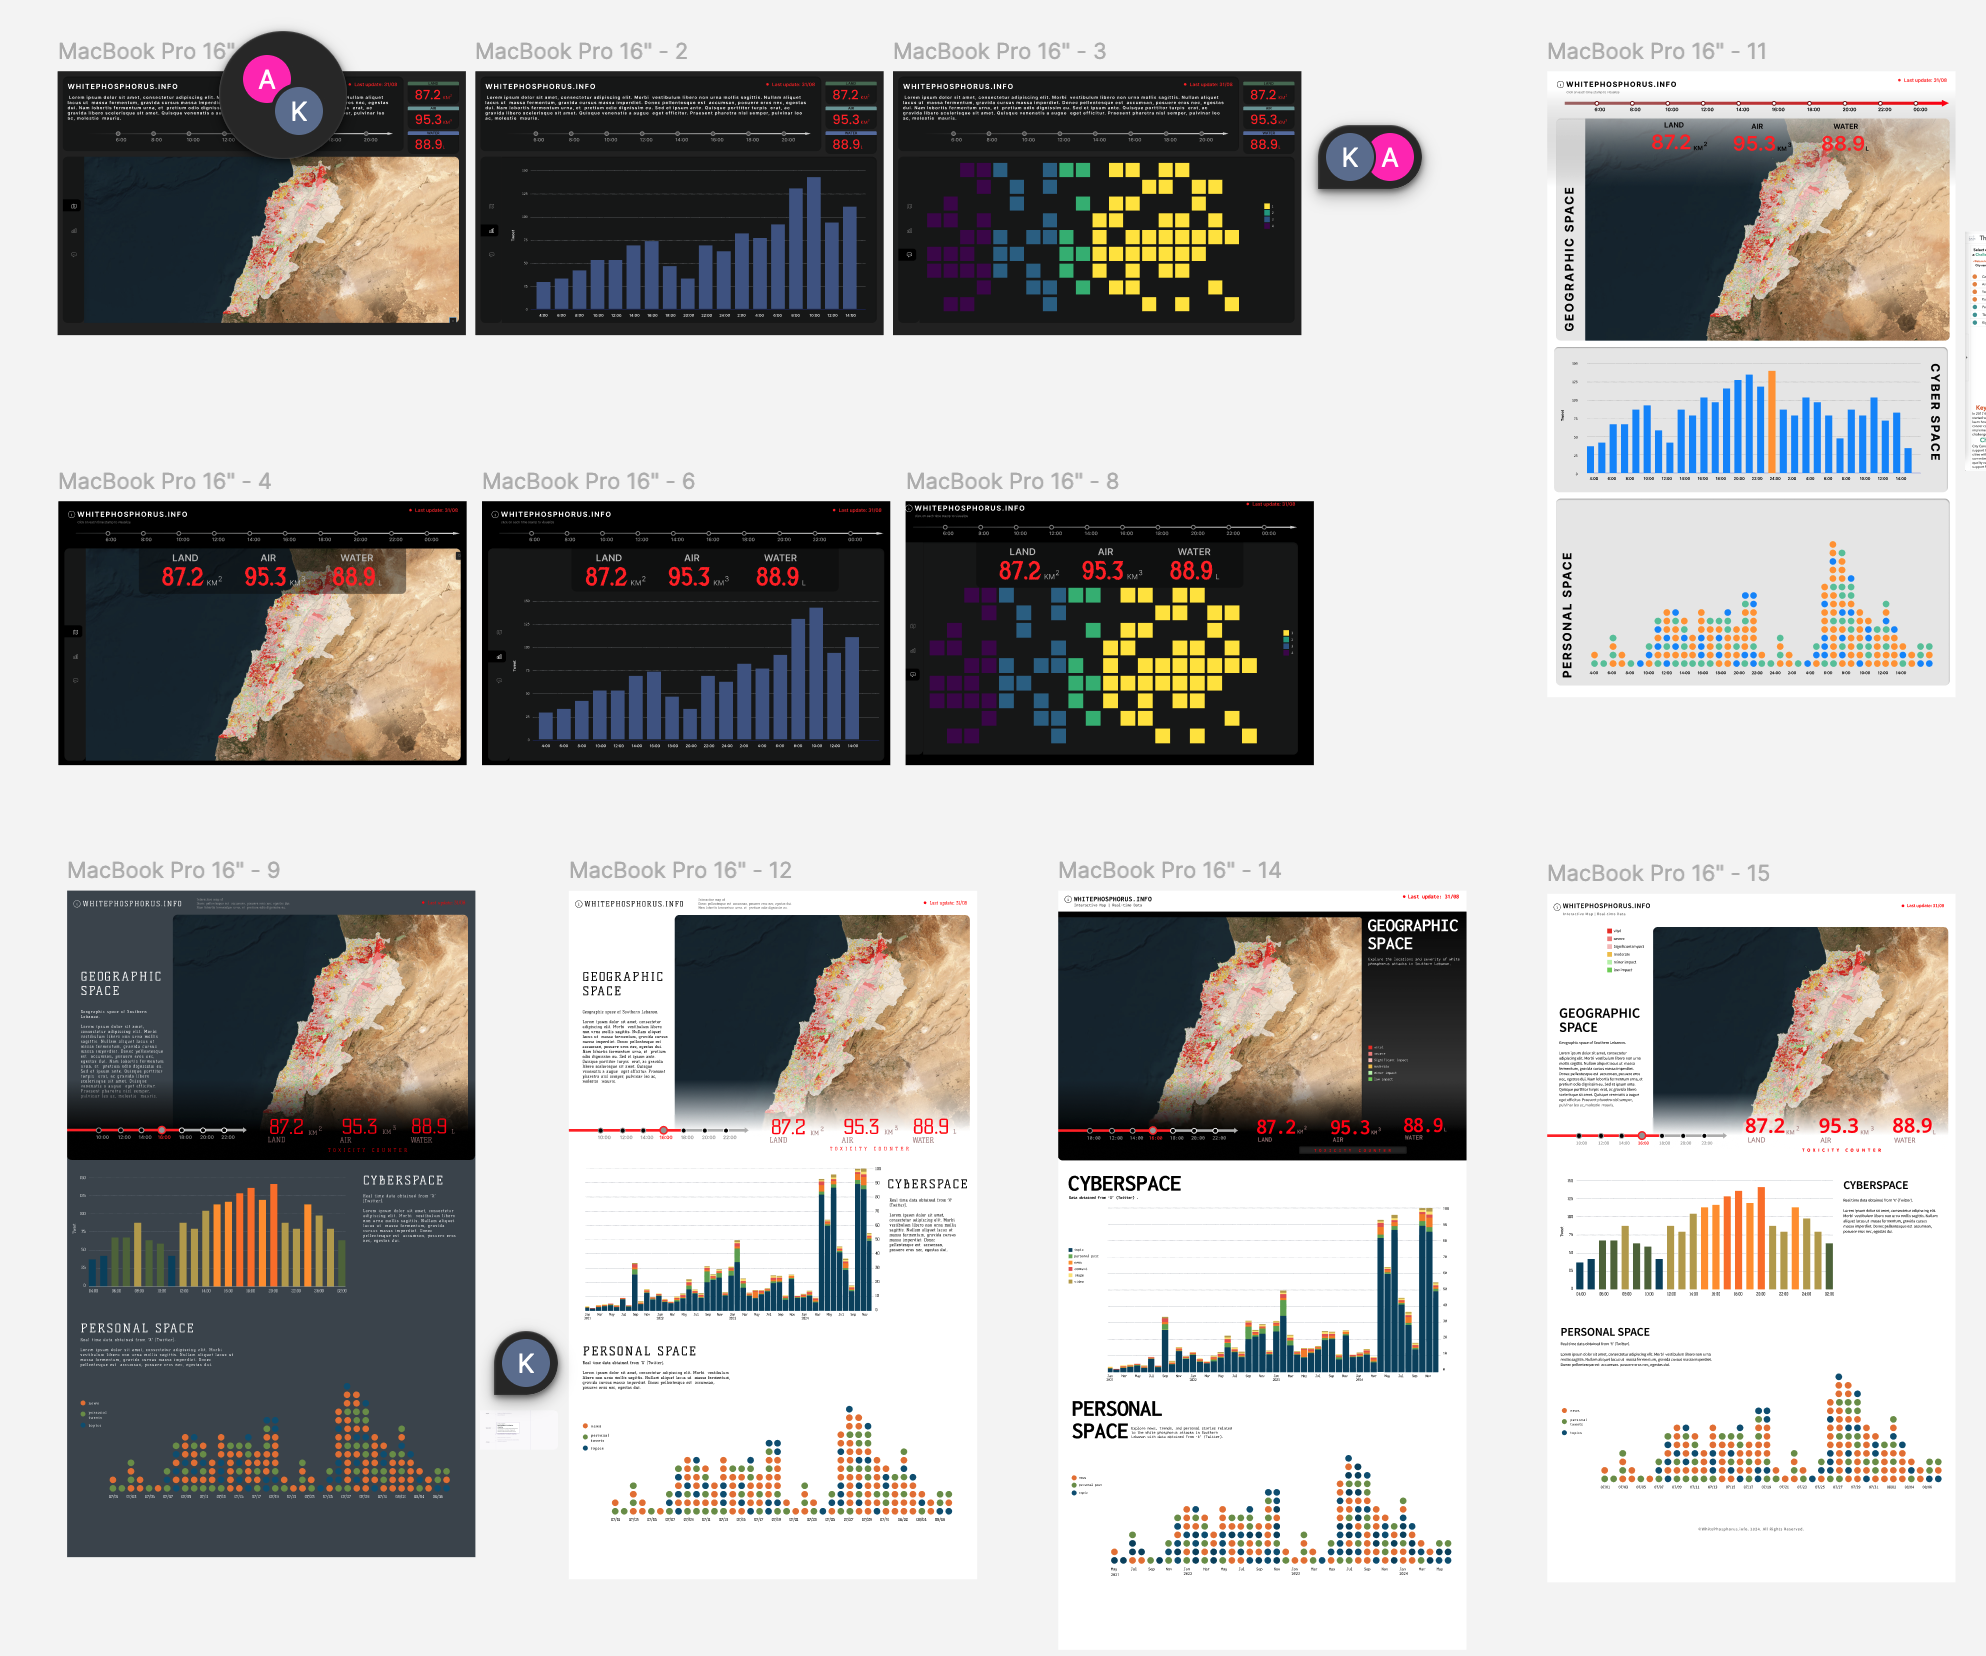
I was commissioned to design and develop the website, including its data visualization components. I began by creating initial design concepts in Figma, focusing on effectively communicating scientific data through clear and engaging visual languages.
Challenges & Solutions


  • Communicating complex data effectively: The primary challenge was to present attack data and associated media footage in a way that is accessible and understandable to a broad audience. My approach involved designing an intuitive interface that emphasized clarity while maintaining the integrity of the information.
  • Balancing aesthetic inspiration and tone: Inspired by the aesthetics of Minesweeper, I incorporated subtle design elements without gamifying the experience. This ensured the gravity of the subject matter was preserved while leveraging familiar visual motifs to aid comprehension.
  • Balancing the user's focus and attention: With multiple dynamic content elements displayed on the site, it was critical to use animation deliberately. I carefully timed movements to draw the user's attention to key areas of the interface without overwhelming them with visual stimuli. This approach helped maintain focus while enhancing the storytelling experience.
  • Creating an alarming atmosphere: To align the design with the gravity of the website's content, I implemented an aesthetic that conveys an urgent and alarming tone. Through the use of stark color contrasts, bold typography, and subtle but impactful animations, the interface evokes the severity of the documented incidents without being overly dramatic or sensational.

Build & Deploy


The website was built using React and Next.js, and Tailwind CSS for styling. The interactive data visualization was made possible with D3.js. The site is hosted with Vercel.